Figure (2)
Figure (2)
How it is written
- (2) 7×
Drawings 1
-
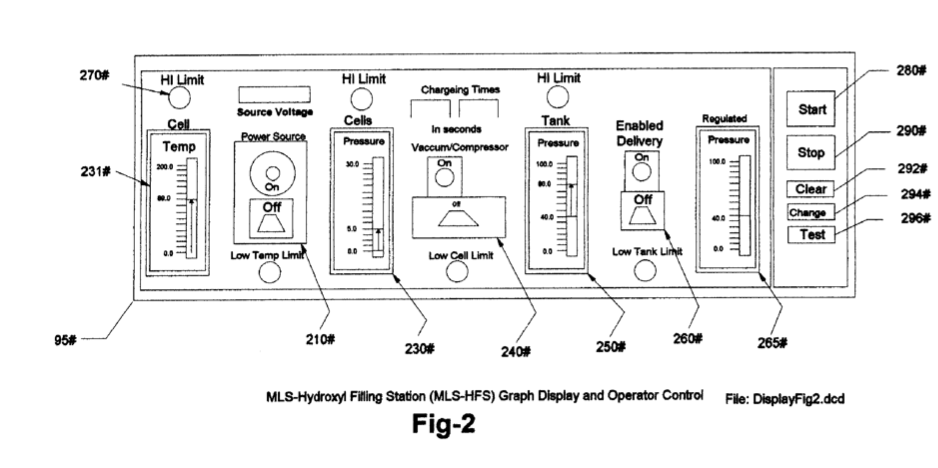
[0005] Drawing FIG. 2 shows the software display the operator uses to monitor and control the production of hydroxyl gascs and heat. · Hydroxyl Filling Station
On this figure 14
- 70 Computer
- 72 Interface Card
- 75 Software Program
- 80 Keyboard
- 85 Pointer
- 90 Monitors
- 95 Graphic Display
- 100 Driver
- 102 Circuits
- 105 Driver Electronics Cards
- 120 Cell
- 131 Electronics
- 210 Cell Power Activator
- 230 Indicator
Where it is named · 7
Hydroxyl Filling Station 7×
-
[0005] Drawing FIG. 2 shows the software display the operator uses to monitor and control the production of hydroxyl gascs and heat.
-
[0012] 'The automatic control section in FIG. 1 consist of a computer 70 software program 75 video monitor 90 and its graphic operator display 95 (FIG. 2) pointer 85 keyboard 80 interface card 72 and I/O controller 100 with its driver electronics cards 102 and 105.
-
[0016] FIG. 2 shows the layout and functions of the operator control display 95 emulating from program 75FIG. …
-
[0031] The MLS-HFS FIG. 1 is monitored and controlled by the soft-ware program 75-computer 70 monitors 90 keyboard 80 pointer 85 and display interface 95, FIG. 2.
-
[0035] Before the system is put into service the operator via the graphic display 95, FIG. 2, keyboard 80 monitors 90 and pointer 85 can test the system for operation. …
-
6. The system according to claim 1 further enhances the production of hydroxyls based on the software program 75 ability to control the production of hydroxyl gases; control- ling its process limits, controlling its storage and controlling its delivery via operator controller FIG. 2.
-
7. The software program 75 according to claim 6 further enhances the safety af the production of hydroxyls based on the monitoring of high and low limits and either alerting the operator of the condition/s and/or stopping the production on device failures via operator controller FIG. 2.