Figure (5)
Figure (5)
How it is written
- (5) 14×
Drawings 1
-
[0021] FIG. 5 · Hydroxyl Filling Station
On this figure 6
Where it is named · 14
Hydroxyl Filling Station 14×
-
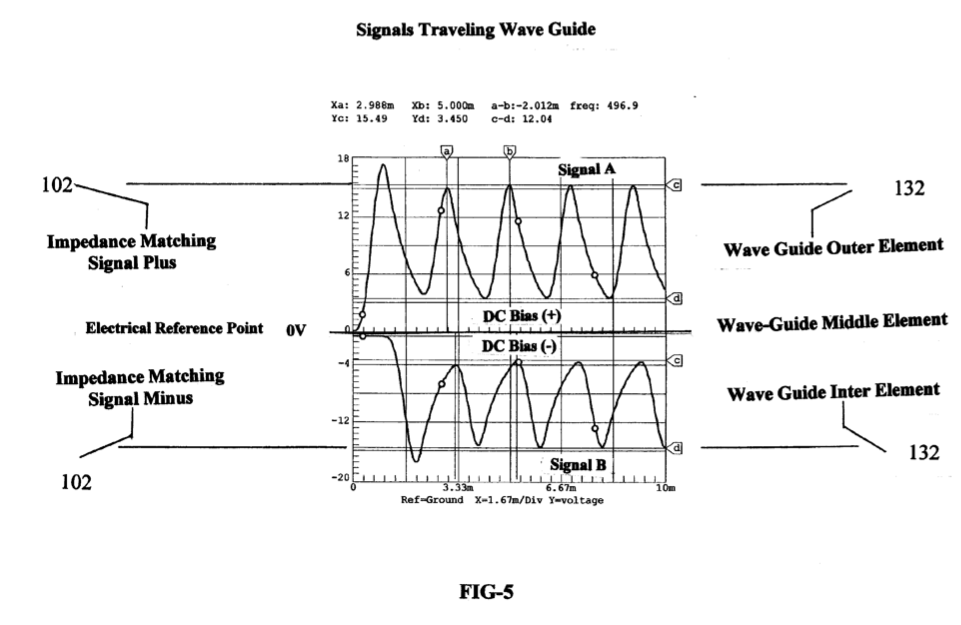
[0008] Drawing FIG. 5 shows the signals applied to each of the arrays 132FIG. 3 installed in hydroxyl cell 120 emitted from each of the impedance matching circuits 102FIG. 4 mounted on PC cards 1-6. These sets of signals FIG. 5 with their offsetting phase relationship, frequencies and amplitudes are the driving forces producing the hydroxyl gases in cell 120FTG. 3.
-
[0008] Drawing FIG. 5 shows the signals applied to each of the arrays 132FIG. 3 installed in hydroxyl cell 120 emitted from each of the impedance matching circuits 102FIG. 4 mounted on PC cards 1-6. These sets of signals FIG. 5 with their offsetting phase relationship, frequencies and amplitudes are the driving forces producing the hydroxyl gases in cell 120FTG. 3.
-
… 'The drawing also shows the water jacket 50 surrounding the cell 120 that helps lower its temperature and allows more production of the hydroxyl gases at higher voltage signals FIG. 5.
-
… 4 convert the AC signal from each phase of 110 into a modulated signal as depicted by FIG. 5. These signals are then coupled to the triple array 132 elements (Inside, Middle, outside) by alternating the connection between the inside and outside elements of the arrays 132FIG. 3.
-
[0021] FIG. 5
-
[0022] FIG. 5 Shows the composite signals applied to each of arrays 132 FIG. 3 submerges in water bath 133 in cell 120 and indicates the differential voltages used in the hydroxyl producing process MLS-HFS.
-
Note the de bias voltage +,- on either side of the center electrical reference point OV in FIG. 5. It is this bias voltage being modulated by multi polarity differential signals from 102 FIG. 4 that contributes to the wave-guide action of arrays 132. Also, the frequency of FIG. 5 is adjusted to match the electrical wave-length of the arrays 132 FIG. 3 and the impedance of water bath 133.
-
Note the de bias voltage +,- on either side of the center electrical reference point OV in FIG. 5. It is this bias voltage being modulated by multi polarity differential signals from 102 FIG. 4 that contributes to the wave-guide action of arrays 132. Also, the frequency of FIG. 5 is adjusted to match the electrical wave-length of the arrays 132 FIG. 3 and the impedance of water bath 133.
-
[0024] FIG. 6 shows the high-frequency ringing signals that contribute to the operation of the hydroxyl production. Just as a tuning fork rings when struck by a hammer, so does the wave-guide elements in arrays 132 immersed into the hydroxyl generating liquid 133 then struck by the electrical signals FIG. 5,6 from impedance matching circuits 102 depicted in FIG. 4.
-
[0039] The result of this is just like the operation of a radio transmitter matching its signal to the air via the antenna impedance. Refer to FIG. 3 showing the relationship of this configuration to arrays 132, water bath 133 and Signals FIG. 5,6.
-
[0044] The impedance matching circuits 102FIG. 4 converts the sinewave signals from the three phase power source L1O FIG. 3 into multi polarity differential signals FIG. 5 that are applied to the triple wave-guide clusters arrays 132 A,B,C,D,L,I installed in cell 120.
-
[0045] Its is this converted signal FIG. 5 along with the phase relationship of the power source 110 and the triple wave-guides element in cluster 132 that are submerge in a water bath 133 that produces the hydroxyl gases. …
-
… It is the combination of the impedance matching circuits 102-signal transformations FIG. 5,6; the cell configuration and materials used in arrays 132 and the rotational phase relationship between arrays AD, BL' and Cl' and the submersion of these arrays 132 in a bath of water 133 that allows the MLS-HFS to produce large amounts hydroxyl gases. …
-
4. The system according to claim 1 further enhances the production of hydroxyls based on the application of the electrical signals FIG. 5 applied to signal traveling wave- guides 132 submersed in a bath of water 133 installed in cell 120 and configured as depicted in FIG. 3.